
Prof. Sivan Toledo
Tel Aviv University, 2011
Project Description
Our project is a GDB port inside an lpc board.
Our target is to make a board that runs a mini debugger.
This mini debugger is actually a mini server that can communicate with GDB and act using a special protocol unique to GDB.
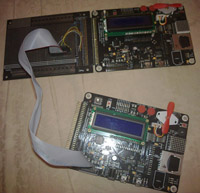
The vision is that one would be able to connect using GDB to a debugger board, and connect that debugger board to a target board that needs to be debugged.
Once the debugger has been connected, the user can just start GDB and tell it to debug using the board’s UART as a serial port.
Then every feature of GDB can be used as if the program was being debugged on a usual PC.
To do this we have used the last year project of Rony Bershadsky & Nimrod Talmon: http://courses.cs.tau.ac.il/embedded/projects/fall2009/JTAG/
Back to top ↑
Technical Overview
We used the code of the JTAG debugger that Rony Bershadsky & Nimrod Talmon built.
We use the uart to communicate with the GDB debugger.
Instead of getting command-line input and outputting our own commands,
GDB is the one that issues commands and communicates according to it's input.
GDB connects directly to the board and communicates with it using the Remote Serial Protocol documented in the GDB manual.
We have implemented an interpreter inside the board that can act according to the Remote Serial Protocol commands.
Once a command has been received, the functions from the JTAG debugger are used to accomplish the required task.
There is also an option for a debugging extension. The software on the board can be put in 'debug' mode, in which case it also outputs debug messages. It is expected that a 'middleman' sits between GDB and the board and logs the debug messages and any other communication.
To do this, two virtual ports (connected to each other) must be created - GDB will communicate with one end, and the 'middleman' will pass everything to the board, and whatever comes from the board (and is not debugging info) will be passed to the GDB port.
We have built such a 'middleman' program called ' gdb _sniffer' that may be used for debugging as long as virtual ports have been setup.
To setup virtual ports the com0com program (for Windows) can be used, or for Linux, the pseudo terminal infrastructure can be used (openpty(3)).
The current version of GDB sniffer works only with Windows, but it can easily be made to work with Linux (we have implemented a Linux GDB sniffer, but we did not include it with the code).
Back to top ↑
Usage
1) Connect the target to the debugger board.
2) Connect the target board to the PC first, and the debugger board second.
2.5) (DEBUG ONLY) run GDB_sniffer (with the proper com ports).
3) Run GDB
4) (In GDB) Load the target program (for instance target.elf), by typing “file program.elf”.
5) Connect to the board by typing “target remote DEV”, where DEV is the device (COM port) that the debugger board is connected to.
Now you can use “step” and “stepi” commands.
You can also see registers contents by typing “info registers”.
If the sniffer is also running then it will display debugging information like debug messages from the board and the communication between GDB and the board.
Back to top ↑
Code
The source code of the project is in src.
It is an open source code.
The lpc2000/ subdirectory has some headers for the board.
The files makefile, makefile.local, startup.S, lpc2148-flash.ld are used to burn programs to the boards.
A 'run' target has been added that only connects to the board without programming it first.
The files print.c, uart0.c, systick.c are used as libraries for synchronization and UART communication.
JTAG.c, arm.c, ice.c are the files that contain the JTAG debugger implementation and export the debugging functions.
gdb_server.c is the state machine that recognizes the Remote Serial Protocol and uses the JTAG debugger functionality to satisfy the requests.
The target/ subdirectory has one file, running_led.c which is loaded to the target for testing purposes.
This program starts with LED12 flashing on the board for three times, and then flashes LED7 to LED13 one at a time.
Back to top ↑
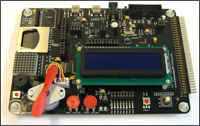
The GDB Debugger in Action
Back to top ↑