RSSI Measurement Sensors Network with Kontiki
Eliran Sinuani
Tengiz Topchiashvili
Abstract
The paper demonstrates the use of sensor networks in combination with the internet. Specifically an RSSI (Received Signal Strength Indication) sensor network.
Rssi sensor networks can be used to estimate the location of a broadcasting beacon the internet connectivity gives the ability to view the results remotely.
Features Used
uIP TCP protocol (To send HTTP strings over the internet)
Kontiki resolv Host name resolver which is built over uIP stack (UDP protocol).
Kontiki Collect a part of Rime protocol stack which implements spanning tree protocol to form networks.
Kontiki Broadcast a part of Rime protocol stack which implements "UDP like" protocol.
Kontiki Slip which is a protocol for broadcasting ip packets over serial ports.
Technologies Used
Google app engine environment and platform for internet servers.
Google BigTable Internet databases which app engine servers can access and manipulate for saving the measurements data.
Kontiki lightweight operating system for embedded systems.
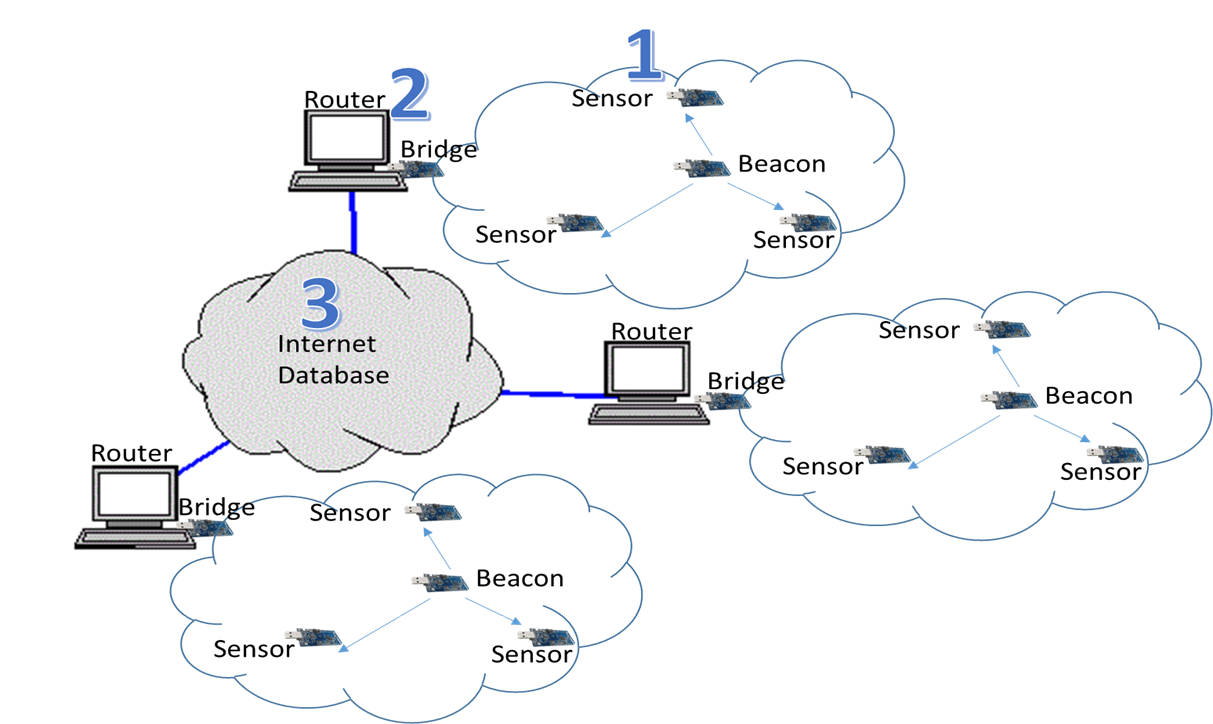
System Description
The system consists of 3 high level parts:
1. The sensor network itself which measures packets from a beacon in range and in turn delivers the measurements to the Routing part of the system.
2. The routing system consists of one Bridge node which "participates" in the sensor network (this node is also a Sensor and the root of the spanning tree) And a router which receives packets over slip from the Bridge node and delivers them to the server.
3. The internet database which receives the measurements and saves them. It is also the point where the user can collect the measurements from several sensor networks.
This system is scalable in the sense that there can be more than one sensor networks (1+2) and more than one beacon which can move between the networks with no additional configuration.
Below is the high level illustration of the system:
Implementation specifics:
1. The Bridge - The Bridge is a contiki with uIP and rime based software running on sky mote. The physical layer of the uIP stack is replaced with slip. The physical layer of Rime is the radio interface.
On startup the bridge is trying to communicate with the gateway over slip and resolve the IP address of the internet server which the measurements should be uploaded to. The Bridge is unaware to the Router which can be any slip capable machine with routing capabilities.
The bridge is collecting measurements from the network and when the number of measurements has reached a certain threshold or a certain period of time has passed (periodic), it creates an HTTP POST message and send it over TCP to the server. The HTTP ACK must contains the number of measurements posted. The periodic update is for smaller networks when the threshold will not be reached in a reasonable time. On the other hand, because of the limited memory of the sky mote only a certain amount of measurements can be saved on the bridge and it should send it before it is forced to ignore new arriving measurements.
The Bridge is also an RSSI sensor in the network.
The Bridge has an error handling as follows:
1. If more than n (can be defined this implementation defines 10) consecutive errors occurs in the http engine (such as NACK from the server \ corrupted or unsupported http header or bad response from the server (which must return the number of measurements posted). The system will enter the error state and will reboot under the assumption that the http engine is out of sync and does not function properly.
2. If the resolver didn't succeed to resolve the address of the server it will default to a known (our http server) IP address (if the address is wrong the system will enter the error state and reboot since the expected answer which is the number of measurements will not arrive or another HTTP or TCP level errors will occur).
3. If the system is in the posting state for more than one minute the assumption is that the HTTP engine is stuck (or the uIP stack) and the system will enter error state and reboot.
4. The Bridge excites the network once in 10 minutes with a beacon signal (even if it's beacon feature is off) this will cause the system to start and send measurements to the bridge even if no beacon is in range and all sensors are with the beaconing feature disabled. If no radio signal (beacon signal or measurement) arrive until the next 10 minutes period the bridge will assume that there is a failure in its RF hardware or in its rime stack and will reboot.
· Rebooting the system has no effect on the operation of the other system components (sensors, beacons and the router).
2. The Router the router in this implementation is a linux machine which runs a slip client which is connected to tun0 interface. The machine is configured for IP forwarding, and the ip-tables are configured to MASQARADE the packets from the tun0 interface as its own and route received packets towards the tun0 interface on arrival.
With the exception of the slip client which is a driver all of the rest are standard linux features which means that the network can be connected to any slip capable router. For example a cellular router with slip support can eliminate the need to deploy the network in proximity to a computer with an internet access.
3. The Beacon The beacon is a contiki with rime based software running on tmote sky. The beacon is attached to the moving object whose location is to be estimated. Every n seconds the beacon transmits a packet with a "Magic Number". (n is a number between 1 and 9 and can be cyclically selected with the user button on the sky mote). The signal nature (beaconing signal to be measured) can be identified by the sensors in the network by its content (the "Magic Number"). This reduces the probability that the network will measure non beacon broadcasting controller and pollute the database with irrelevant data.
4. The Sensor The sensor is a contiki with Rime based software running on tmote sky. The sensor is a node in the sensor network. When a beacon signal is identified by the sensor it creates a measurement packet and sends it to the root (sink) of the collection. The sensor does not have a memory and it does not "Hold Back" measurements if they arrive in close intervals. It is the Bridge's responsibility to manage the measurements that are sent to the database. The sensor can also function as a beacon (we decided that its signal will be sent every 30 seconds). The sensor state (beacon\not beacon) can be toggled with the user button of the tmote sky. The beaconing capability has 2 purposes, one practical and the other systematic. When a sensor stops working we would like to get an indication for this remotely (There can be more than one network in more than one location) when the sensors are measuring one another it is relatively easy to map the network in terms of visibility (which sensors are connected directly) and to know when a sensor is not working, this can be done when the database timestamps the received measurements. The other and more important reason is that better results in estimating the beacon location can be achieved if one can estimate the link quality in the area using known radio links (known in sense of location and distance).
5. The Database Google App Engine's data repository, the High Replication Datastore (HRD), uses the Paxos algorithm to replicate data across multiple data centers. Data is written to the Datastore in objects known as entities. Each entity has a key that uniquely identifies it. An entity can optionally designate another entity as its parent; the first entity is a child of the parent entity. The entities in the Datastore thus form a hierarchically structured space similar to the directory structure of a file system. An entity's parent, parent's parent, and so on recursively, are its ancestors; its children, children's children, and so on, are its descendants. An entity without a parent is a root entity.
Let L be a list of n measures posted by a given contiki to our UpdateDBServlet, when each measure is introduced by a <SID,BID,RSSI> (sensor-ID, beacon-ID, rssi-signal power) For each such measure M, it is parsed into a Measure java-object, and using the JDO PersistenceManager, it is saved in our datastore with a timestamp attached. We configured the application s.t it saves only the last few measures history for each <SID,BID> (hardcoded with a MAX_NUM_OF_MEAS_PER_PAIR parameter which is currently set to (3) Once we want to retrieve the stored data in the datastored to a variable in our servlet, we use the JDO query and the data returned is ready to be set to a list of the appropriate objects.
6. The Map A self-refreshing page at the address: http://shimoneliranproject.appspot.com/map.jsp is maintained to view the projects actual process and results.This page contains a drop-down-list , google map, and a datalist. The drop-down-list contains a list of all beacons IDs ever measured by any sensor which belongs to the sensors-network, which is introduced by the markers set on predefined coordinates on the google map.
One can choose a beacon ID from the DDL, and then the map is locally refreshed to show the appropriate results as you hover with the mouse on the markers.
Using AJAX, once the beacon ID is chosen, an http get request is sent to our MapServlet retrieving all the data about this beacon ID.
When a beacon is chosen, when one hovers a marker, one can see the sensors last few measurements for that BID in a table, which is introduced by that marker, and when a beacon is not chosen the markers bubbles say that no beacon is chosen.
7. The Link estimation page A list of co-measurements of the permanent-located sensors, in order to give the user enough stable information about the ratio between the RSSI signal and the physical location, to be able to revalue the beacons physical routes using different algorithms, the co-measurements of the sensors can be used to estimate the link quality across known radio links. In addition it allows for estimating the visibility of the network (only directly linked sensors can measure each other) in addition it can yield an indication on a sensor which has stopped working. The page is located in: http://shimoneliranproject.appspot.com/linkEst.jsp
Known Isues and changes to the contiki system
1. As for now the server can be moved to another IP and the system will continue to work. But we encountered networks where the DNS server is incompatible with the resolver code in contiki this causes the Bridge not to be able to resolve the IP address of the server. We have created a fallback which on failure to resolve the IP, uses a known IP of our server.
2. The resolver code of the contiki system contained a bug in parsing of the DNS response. This caused a non-even lengthen names not to be resolved due to alignment error (the bug occurs in every machine on which the memory architecture is 2B or 4B aligned). We fixed it by copying the DNS response header into a structure instead of casting it as is.
3. For some reason 2 of the sky boards had the same rime address. We solved this by assigning Hard Coded Rime address to ALL of our boards.
4. The system is fairly stable (Tested without active network with 4 sensors all beaconing and a beacon with intervals of 5 seconds and ran for 8 hours, and tested with network connection holding for 4 hours in 2 minutes interval in posting online, During the last approximately 2 hours the system got error from the server indicating that the quota of db-writes has ended but it still posted for 2 hours), however, the slip Tx is ocasionaly stuck (no red mini-led activity and we couldnt overcome this problem) this was observed in approximately 10% of the runs. Out suggested method for solution is forcing reset from the computer side but we didn't implement it.
5. The Leds interface is mainly for debugging and monitoring therefore when the system is overloaded the leds interface might "glitch" from time to time or the leds steady state is becoming on instead of off.
6. We are working on a server which limits the number of database writes and reads per 24h period. Therefore we use a relatively small list of measurements (5). And long periods of time (Whole minutes) in our code (can be changed with define). This only means bad time resolution. For each ordered pair (Sensor,Beacon) if it already exists in the list and the measurement still hasn't sent to the server an update will occur so the measurements posted are the most recent ones even with long periods of time.
How to Use The System (on Linux systems)
A Preparing the router
1. Open a new shell and login as root user.
2. Compile the attached "tunslip" project (make tunslip)
Method 1 : Run the submitted script initRouter
Method 2: Enter the following commands (IP Forwarding + IP Tables) :
>iptables -t nat -A POSTROUTING -o eth0 -j MASQUERADE
>sysctl -w net.ipv4.ip_forward=1
> sysctl net.ipv4.ip_forward
After the last command verify that the print is: "net.ipv4.ip_forward = 1" and not
"net.ipv4.ip_forward = 0"
· There may be a need to alias the gateway (of the NAT) as: 192.168.5.2 for the resolving process to work.
B Activate the Gateway (Contiki Bridge)
1. Insert the gateway into the usb port.
2. Run the previously built tunslip binary as follows:
./StartTunslip (submmited with code)
or
"./tunslip -s /dev/ttyUSB0 -B 115200 192.168.1.1 255.255.255.0"
3. Push the reset button on the tmote sky.
4. The leds will blink for a while and the will go off when all leds are off the bridge is ready.
The system should work now and post measurements when a beacon is in the range of the network.
C System Options and Leds Meaning
1. The beacon:
Blue Led - Every time the beacon sends a packet the Blue Led will blink once.
User Button - The user button adjusts the beacon signal intervals between 0 9
When 0 is OFF and 1-9 is the interval in seconds.
It is recommended to set the interval >5 to avoid overloading the system and to avoid frequent posts to the internet.
2. The Sensor:
Blue Led The meaning of the blue led is as the beacon.
Green Led each time a beacon signal is received the green led will blink once. This also means that the sensor is sending the measurement to the Bridge.
User Button the sensor is defaulted (after reset) to send beacon signal once every 30 seconds. The user button toggles the feature on and off.
3. The Bridge:
On boot all leds should blink for a short time, after all leds are turned off the blue led will blink while the bridge is trying to resolve the IP of the server. When the resolving process has completed all leds will turn off and from that point the following interface applies:
Blue Led the blue led blink once if a measurement or a beacon signal is received.
Red Led - the red led blinks when an error occur. This is not necessarily fatal but most of the time indicates that one or more measurements have been lost (not saved). If the red led blinks for more than a few seconds a fatal error has occurred and the bridge needs to be booted and it will do so by itself the system recovery method for fatal error.
Green Led the green led blinks whenever there is an internet activity.
User Button The Bridge is also a sensor and the user button has the same functionality as of the sensor.
D Using the App Engine interface
· Adding sensor locations:
http://shimoneliranproject.appspot.com/addSen.jsp
You have to enter the new sensors ID and its location in terms of google-map latitude and longitude.
· Using the map:
http://shimoneliranproject.appspot.com/map.jsp
For setting the refresh interval in milliseconds, use:
http://shimoneliranproject.appspot.com/map.jsp?timout=n (where n is the refresh interval in milliseconds)
As explained in the map section above, just choose a beacon, hover over the markers and view the results.
· This Document:
http://shimoneliranproject.appspot.com/doc.jsp
· Link Estimation page:
http://shimoneliranproject.appspot.com/linkEst.jsp