Vadim Rozenfeld (vadimroz31 at gmail dot com) , Shachar Stelzer (shachar.stelzer at gmail dot com)
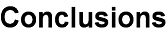
This is a final project at "Advanced Computer Systems: Embedded Systems" 2013B workshop, Tel-Aviv Univ under the supervision of Prof. Sivan Toledo. We used TelosB which is an educational board and Contiki, an open source development environment, to establish a system that collects certain measures, analyze them and (try to) determine whether a given cooling system perfroms adequately.
Nowadays, cooling systems play a major role( sometimes even decisve) in many fields of life, such as Server Rooms and Data Centers . It is not surprising computers generate heat on the one hand, and very sensitive to heat and humidity on the other. Maintaining a stable temperature and humidity within tight tolerances is crucial to IT system reliability.
In accordance to "Ventilation and Cooling Requirements for ICT rooms" guide the ideal temperature in an ICT room is between 20 and 25°C.
But how can one be sure that each and every part of a server room is being cooled equaly ? Or more specifically, how can one design and optimize a cooling system that performs best in a given room ?
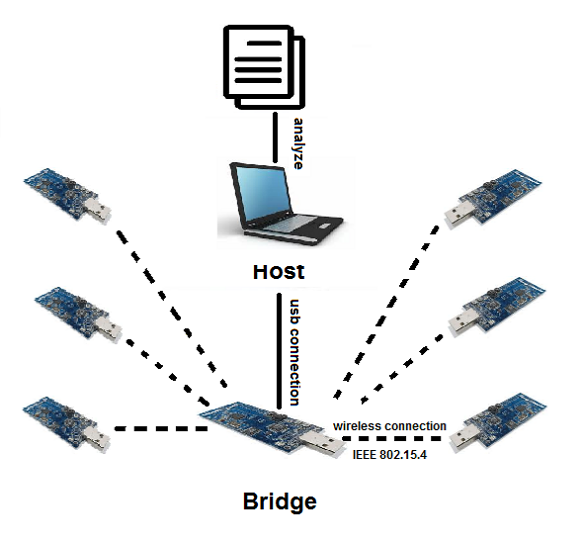

1. Connect the bridge to the host.
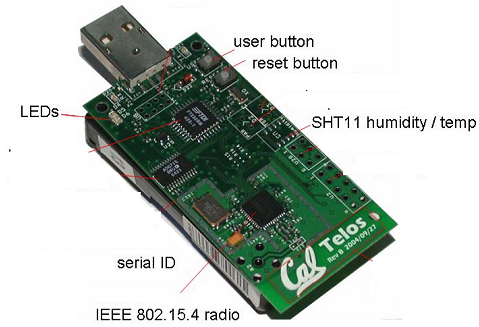
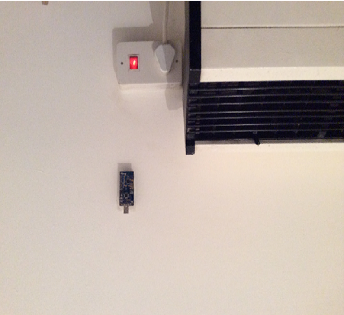
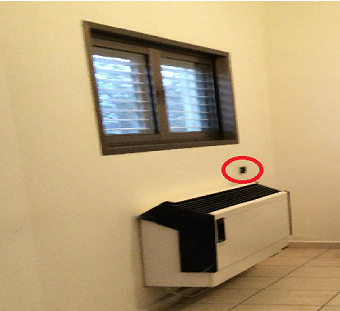
2. Place several TelosB devices around the room. It's highly recomended
to place at least one of them near the AC unit. Others should be located at different spots.
3. Wait a few seconds and make sure each device established
connection. It's preferable to index them such as node#1, node#2 etc.
( by defualt each board has a unique IP)
4. Once an edge device establish connection a blue LED should blink
5. Now each adge samples temperature and humidity and
sends them in wireless connection.
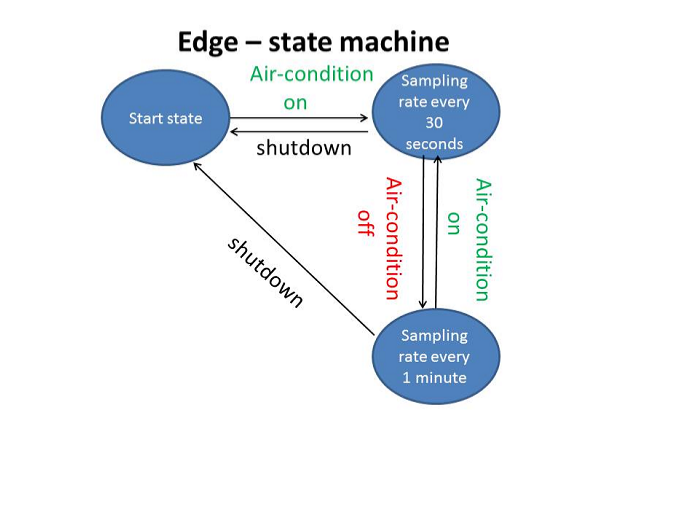
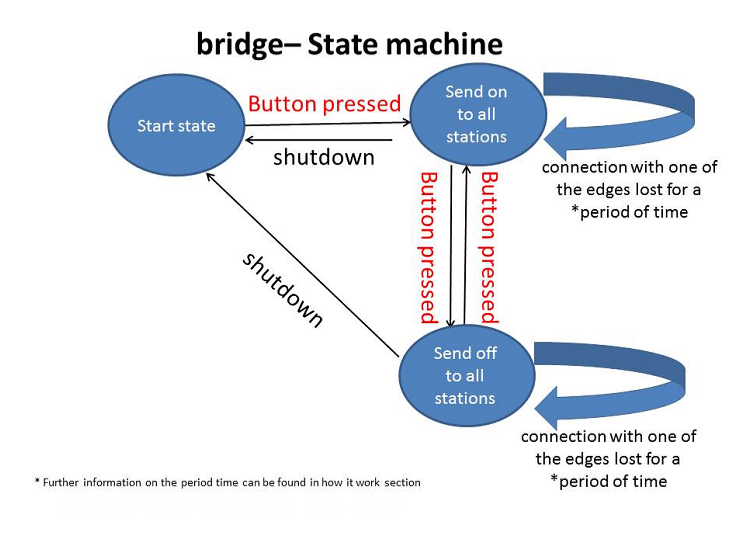
6. In order to increase sampling rate press the bridge's reset button once.Pressing on the Button again will decrease the rate and vice versa. It's highly recommended to perform this process several times with fixed interval. That way, you might notice the cooling\heating rates of your space.
7. Now samplings will be sent more frequently. By default a "normal
sample" is at rate of every 60 seconds. One can change the rates easily.
8. At the end of the process the host will exceute calculations and perform
analysis.

There several measures that can be taken in order to improve the system.For instance, making it "Real Time". Rather than calculating and analysing data at the end of the process, it would be more efficient to monitor it on real time. Designing a program that produce dynamic graphs and signals at any crisis or unexpected events. It might be even used as monitor.Moreover, one might find storing the result at a DB very useful for future comparision and research. In addition, the current system lack of sensors to gauge dust and dirt, which are pretty important parameters, as their incursion ought to be prevented.
- Contiki Event Timers
- Contiki Processes
- Contiki Threads
- Contiki Clock & Time
- Contiki RimeBroadcast
- Sht11 Light\Temperature
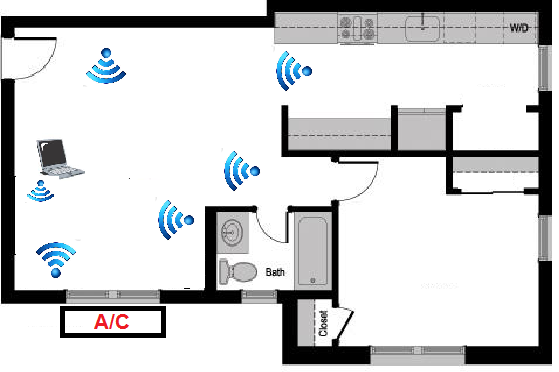
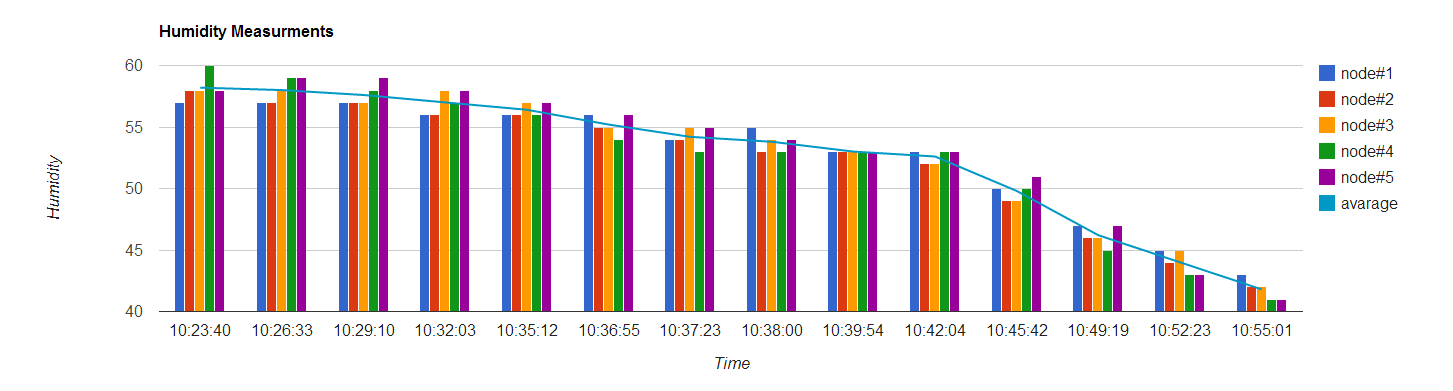
Below you can find the results of a single test made at an ordinary living room. Unfortunatly, we had some troubles with conducting our small research in a real server room / data center
Google Visualization API Sample
Some of the Edges sampled different temperatures (and humidity which derives from temperature) while placed at the same spots. Taking into account that some of them are prone to mistakes and flaws, we were obligated to omit some of samples. Fortunatly, there were only few of them, and it did not have a significant effect
Once two Edges (or more) are placed too close,that is less then 50 cm, they tend to behave abnormally. In other words, they send strange messages. Therefore, the bridge ought not to be be found too close to any of the Edges.
While tring to exctract the results sent to the Bridge we had serious troubles. Contiki does not support working with external files but saves them rather locally on the chip. As we could not overcome that obstacle, we were forced to use a third part software to produce the graphs
A/C performance over the period and results shown above.
We designed a system that might offer a solution to optimization of Data Rooms Cooling systems and A/C's. As EE students we used our knowledge in signals analysis. That is, we tried to increase/ decrease sampling rate for several reasons.The first, to save battery. In other words, we increased the rate once the AC was turned on.The second is to get more accurate reasults.The last one is to reduce the traffic at the network. It is pointless to sample static situation.Moreover, as mentioned at the inhancment section, the system would be more efficient being used real time.